
Energy Charts
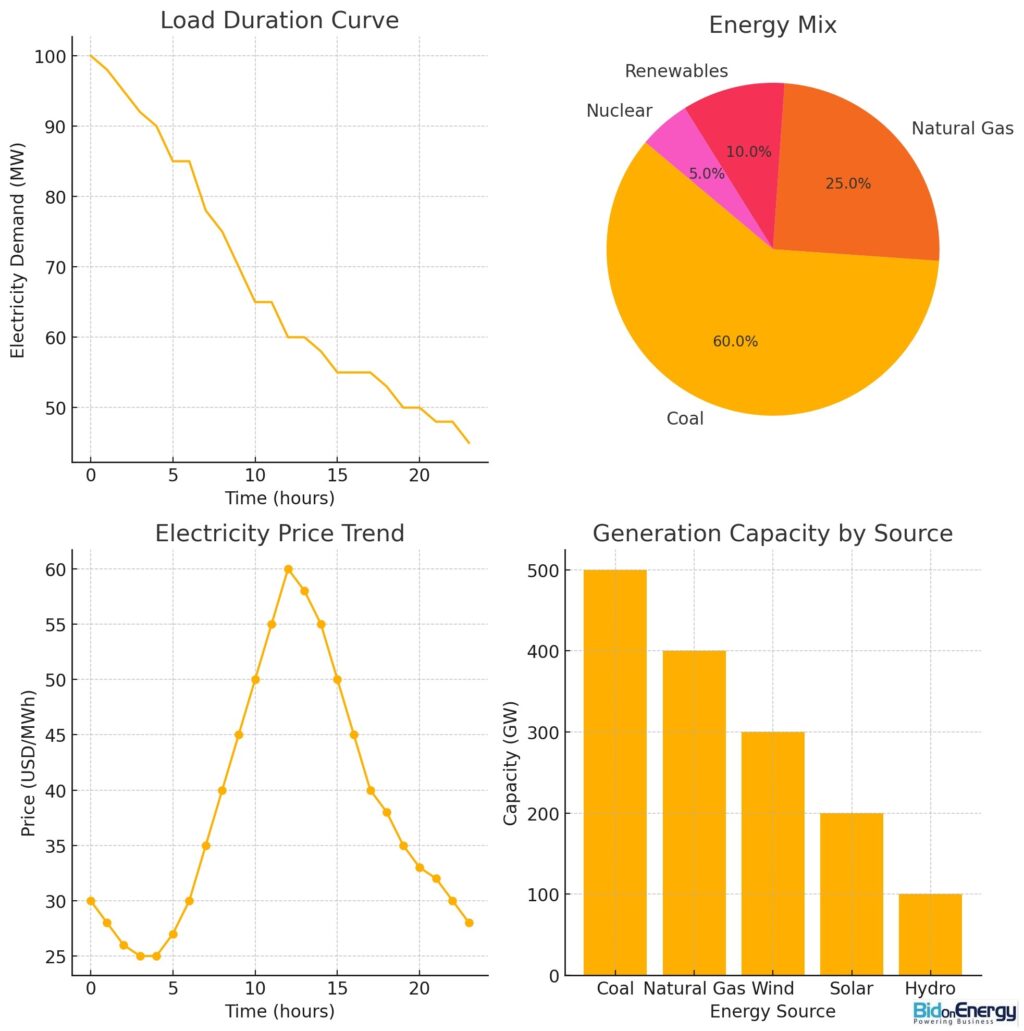
In the electricity industry, one of the most commonly used charts is the Load Duration Curve. This chart is essential for understanding electricity demand patterns over time. It ranks power demand from highest to lowest over a given period (typically a year) and is used to determine how much capacity is needed to meet peak…
Read more