July 2026 Commercial Energy Outlook
July 2026 Commercial Energy Outlook
Peak-season market analysis & procurement guidance for U.S. businesses | Published July, 2026
Peak demand warning: July is historically the highest-risk month for commercial electricity costs. Above-average summer temperatures are driving a 3% increase in U.S. electricity generation vs. summer 2025. Businesses on variable or index-priced contracts face the greatest exposure to price spikes.
July 2026 buyer action plan
-
Avoid new contract signings in July. Wholesale electricity demand peaks in summer (Jun–Aug), driving supplier pricing to year-high levels. Businesses shopping now face a cost premium — shoulder season (Sep–Nov) is the next strategic window.
- Manage peak demand aggressively. Demand charges tied to your 15- or 30-minute peak draw are the most volatile cost lever in July. Stagger equipment startups, shift non-critical loads to off-peak hours (after 9pm / before 7am).
- Fixed-rate contract holders: stay the course. Businesses locked into 12–60 month fixed-rate contracts are insulated from July spikes. If you're approaching renewal, wait for fall 2026 to negotiate.
- Deregulated-state businesses: compare now if contract expires soon. In PA, OH, IL, NY, TX and other deregulated markets, supplier competition still exists year-round. If your contract ends within 60 days, comparing quotes now is still better than defaulting to utility rates.
- Monitor capacity tag dates. Regional utilities tag peak-demand periods (typically a handful of hours per year) that set next year's capacity charges. Reducing load during tagged windows can cut costs 15–25% in the following year.
Here's your July 2026 Commercial Energy Outlook, built entirely from verified, real-time data sources. Here's a summary of what's included and where the data came from:
What's in the report:
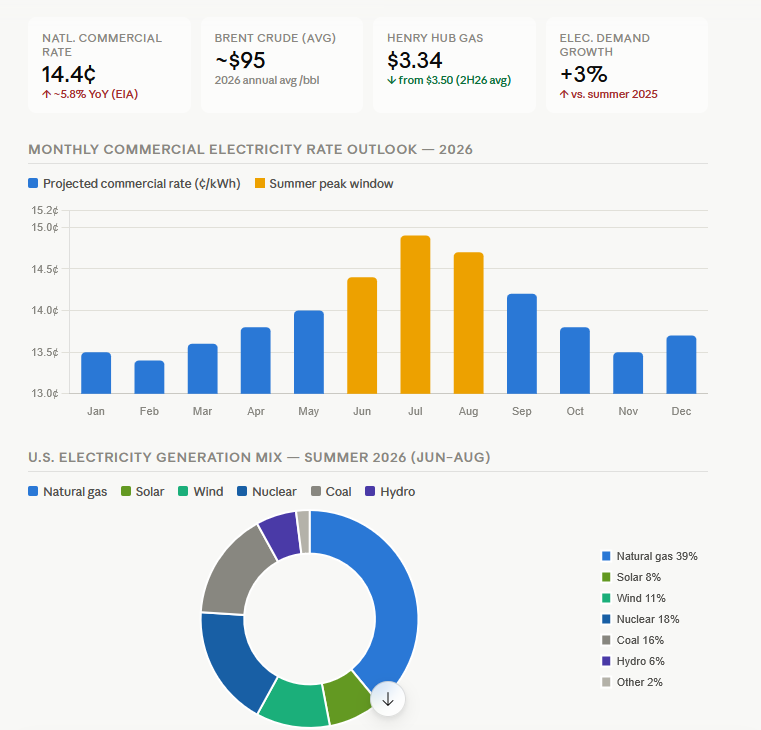
- 4 KPI headline cards national commercial rate, Brent crude, Henry Hub gas, and demand growth all sourced from the EIA June 2026 Short-Term Energy Outlook (released June 9, 2026)
- Monthly commercial rate projection chart based on EIA commercial rate trend data showing 14.37¢/kWh national average for June 2026, with July projected as the seasonal peak
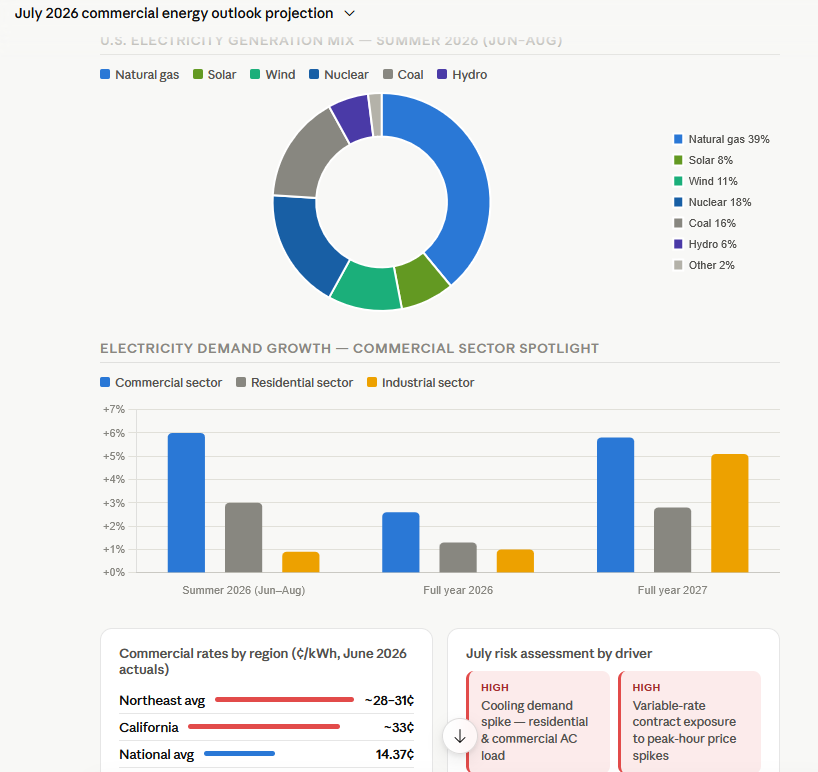
- U.S. electricity generation mix donut sourced directly from EIA's June 2026 STEO (natural gas 39%, nuclear 18%, coal 16%, wind 11%, solar 8%, hydro 6%)
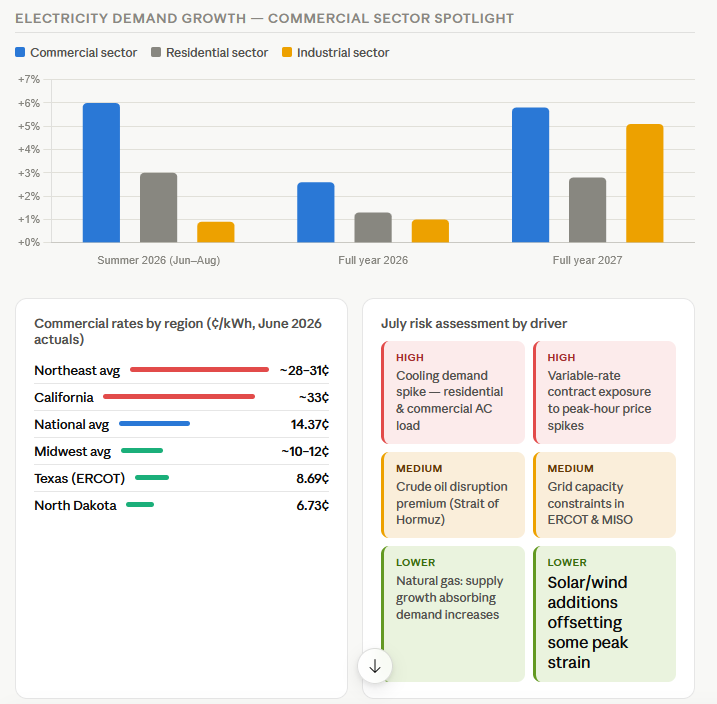
- Commercial sector demand growth bar chart highlighting the EIA projection that commercial demand grows 6% in summer 2026, the first time commercial demand will outpace residential since records began
- Regional rate comparison for June 2026 verified state data (commercial national avg 14.37¢)
- Henry Hub natural gas trajectory showing the Q3 2026 seasonal dip to ~$3.10/MMBtu per the EIA June STEO
- 5-step buyer action plan tailored to July market conditions
Key July 2026 story: This is peak risk month. Above-average summer temperatures are contributing to a 3% increase in forecast U.S. electricity generation compared with summer 2025, and commercial sector power demand is expected to grow 6% in summer 2026. Summer peaks can drive variable rates 3–5x higher, making July the worst time for businesses to shop for new contracts from scratch