
Energy Charts
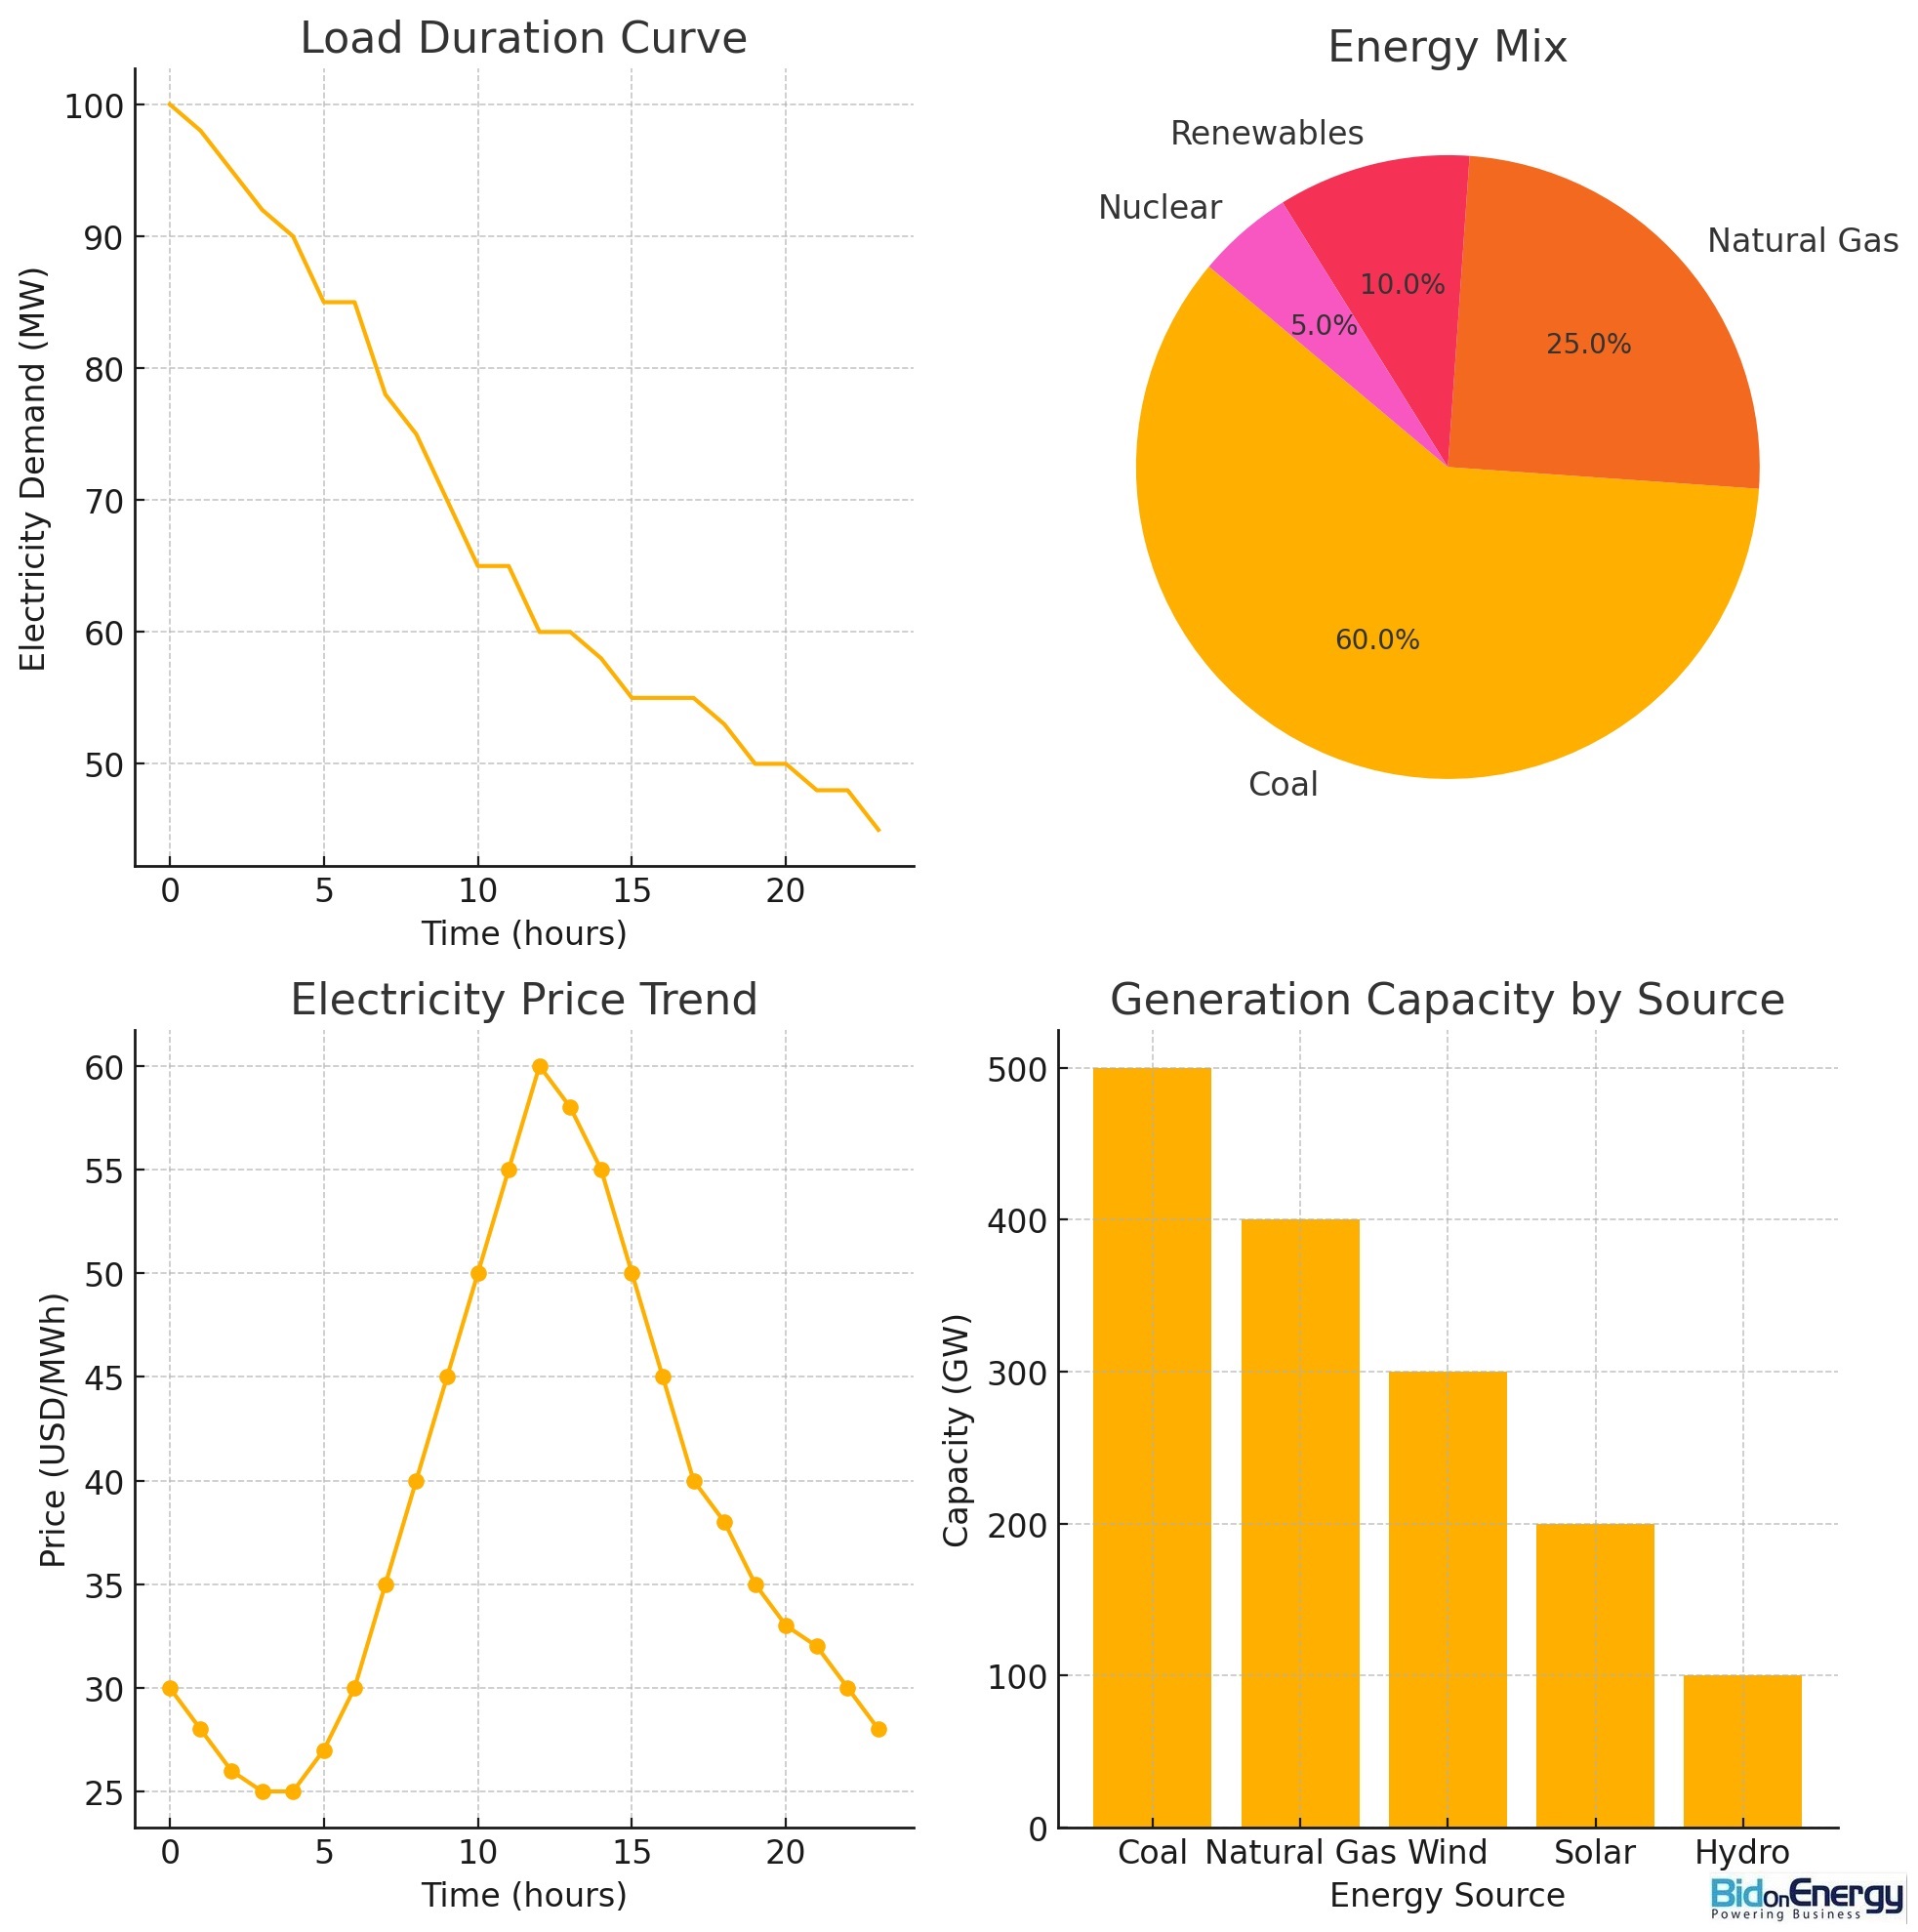
In the electricity industry, one of the most commonly used charts is the Load Duration Curve. This chart is essential for understanding electricity demand patterns over time. It ranks power demand from highest to lowest over a given period (typically a year) and is used to determine how much capacity is needed to meet peak and off-peak demand.
Other frequently used charts in the electricity industry include:
- Energy Mix Pie Chart: This shows the proportion of different energy sources (e.g., coal, natural gas, renewables, nuclear) used for electricity generation.
- Electricity Price Trend Chart: This line chart tracks historical electricity prices, often comparing fixed and variable rates or tracking prices for specific regions.
- Supply and Demand Curves: These charts visualize the relationship between electricity supply and demand, showing how price and consumption levels shift over time.
- Generation Capacity by Source: Often displayed as a bar chart, it shows how much electricity is being generated by different types of power plants, like renewables, coal, or gas plants.
These charts help utilities, regulators, and businesses plan, manage, and forecast energy needs and costs.
Why Your Company Should Use Energy Charts and How Bid On Energy Can Help
In today’s competitive business environment, energy costs play a critical role in determining a company's bottom line. Energy usage is often one of the most significant operational expenses, particularly for companies operating in energy-intensive industries. To stay ahead, businesses need tools that help them optimize their energy consumption and reduce costs. One of the most effective tools available is energy charts. These visual representations of data provide valuable insights that enable companies to manage their energy usage more efficiently. Here's why using energy charts can transform your business—and how Bid On Energy can help.
What Are Energy Charts?
Energy charts are visual tools that help businesses track and analyze energy usage, pricing trends, and demand patterns. They can range from simple graphs showing hourly energy consumption to more complex visualizations, such as load duration curves and pie charts illustrating energy source distributions. These charts are invaluable for companies looking to reduce energy waste, optimize consumption, and cut operational costs.
Types of Energy Charts Used by Businesses
- Load Duration Curves: These charts rank a company’s electricity demand from highest to lowest. They allow businesses to understand their peak demand periods, which often come with higher costs. By identifying peak times, companies can shift non-essential operations to off-peak hours, reducing electricity costs.
- Energy Mix Charts: Pie charts showing the proportion of different energy sources (e.g., coal, natural gas, renewables) used by a company can highlight areas where renewable energy could be adopted to reduce environmental impact and qualify for green energy incentives.
- Electricity Price Trend Charts: These line graphs track electricity price fluctuations over a period, helping businesses understand when energy prices are higher and lower. Monitoring these trends allows businesses to purchase electricity at optimal times, securing lower rates.
- Generation Capacity by Source: Bar charts that display the energy generation capacity by source provide insights into how much energy is being produced from various sources, such as solar or wind, compared to traditional fuels like natural gas or coal.
Why Should Companies Use Energy Charts?
- Cost Savings Energy charts give companies the ability to pinpoint exactly when, where, and how much energy they are using. Armed with this information, businesses can make informed decisions, like adjusting operating hours or upgrading equipment, to optimize energy use. This results in significant cost savings.
- Identifying Inefficiencies Energy charts help to reveal inefficiencies in energy usage. For instance, a business might discover that equipment left running during non-operational hours is unnecessarily driving up energy costs. With data clearly visualized, inefficiencies become easier to identify and rectify.
- Better Demand Management Load duration curves and price trend charts help companies better manage demand by shifting operations to off-peak periods when energy costs are lower. This not only saves money but also reduces strain on the grid, which can sometimes lead to additional costs or penalties.
- Sustainability Goals Tracking the energy mix allows companies to incorporate more renewable energy sources into their operations. This contributes to sustainability goals and can also qualify the business for tax incentives or rebates designed to encourage the use of renewable energy.
- Energy Procurement Strategy Electricity price trends and load data can inform an optimized procurement strategy. By analyzing historical data, businesses can predict when energy prices will be low and lock in more favorable energy supply contracts.
How Bid On Energy Can Help Your Business
While energy charts are powerful tools for managing energy consumption, having access to competitive energy rates is just as important. This is where Bid On Energy comes in. Bid On Energy is an innovative platform that helps businesses compare and shop for the best electricity and natural gas supply rates from multiple suppliers.
Key Benefits of Using Bid On Energy:
- Rate Comparison: Bid On Energy allows you to compare energy rates from multiple suppliers, ensuring that you get the best possible deal for your business. This is especially useful when paired with the insights provided by your energy charts, as you can identify the most cost-effective times to purchase energy.
- Tailored Solutions: Every business is different, and Bid On Energy helps you find energy supply plans tailored to your specific needs. Whether you require a fixed-rate plan to protect against market volatility or a variable-rate plan for more flexibility, Bid On Energy has options.
- Transparency: With Bid On Energy, you can view transparent pricing and contract terms, helping you avoid hidden fees or surprises down the line. This level of clarity allows businesses to make more informed decisions when choosing energy suppliers.
- Expert Guidance: The team at Bid On Energy provides expert advice and insights to help businesses navigate the complexities of the energy market. With their help, you can craft a strategy that aligns with your company’s goals and financial plans.
- Free, No-Obligation Quotes: You can obtain a free, no-obligation quote from Bid On Energy, which helps businesses explore their options without any upfront commitment. This makes it easier to shop around and find the best deal for your company.
Energy charts are essential for businesses looking to optimize energy usage, cut costs, and meet sustainability goals. By visualizing key data, businesses can make better decisions about when and how to consume electricity. But understanding energy usage is only half the battle—securing the best energy rates is equally important. That’s why partnering with Bid On Energy is the smart choice for businesses looking to save on energy costs.
Whether you're aiming to improve energy efficiency, reduce peak demand costs, or transition to renewable energy, energy charts paired with Bid On Energy's services offer the perfect solution. Take control of your energy strategy today and start making informed, cost-effective decisions for your business.
For more information, visit Bid On Energy or call (302) 360-8110 to get started with a free energy supply comparison and find out how much you can save on your commercial electricity rates.
