
2027 Commercial Electricity Forecast

2027 Commercial Electricity Forecast and Cost Outlook for Businesses
Businesses should prepare for a modest increase in average commercial electricity prices in 2027, with substantial differences by region and account. The U.S. Energy Information Administration projects a national commercial retail average of 14.26 cents per kilowatt-hour, compared with 14.01 cents in 2026. That is an increase of approximately 1.8%. The forecast comes from EIA’s November 2026 Short-Term Energy Outlook, released November 10 and completed November 5
For a business owner, the useful question is how those market conditions translate into the next electricity agreement. Your utility territory, operating hours, peak demand, contract expiration date, and the charges included in a supplier’s proposal can make your outcome very different from the national average.
Bid On Energy’s recommendation is to build a clear budget, compare several qualified suppliers on equivalent terms, and choose the lowest suitable offer among the proposals available for your account. A disciplined comparison can reveal opportunities that a national forecast alone cannot identify.
The national commercial electricity forecast for 2027
The latest EIA outlook shows slower price growth in 2027 than in 2026, while keeping the national average above its recent historical level.
| Year | Commercial retail average | Annual change | Data status |
|---|---|---|---|
| 2025 | 13.37¢/kWh | +4.9% | Historical actual |
| 2026 | 14.01¢/kWh | +4.8% | Estimate and forecast |
| 2027 | 14.26¢/kWh | +1.8% | Forecast |
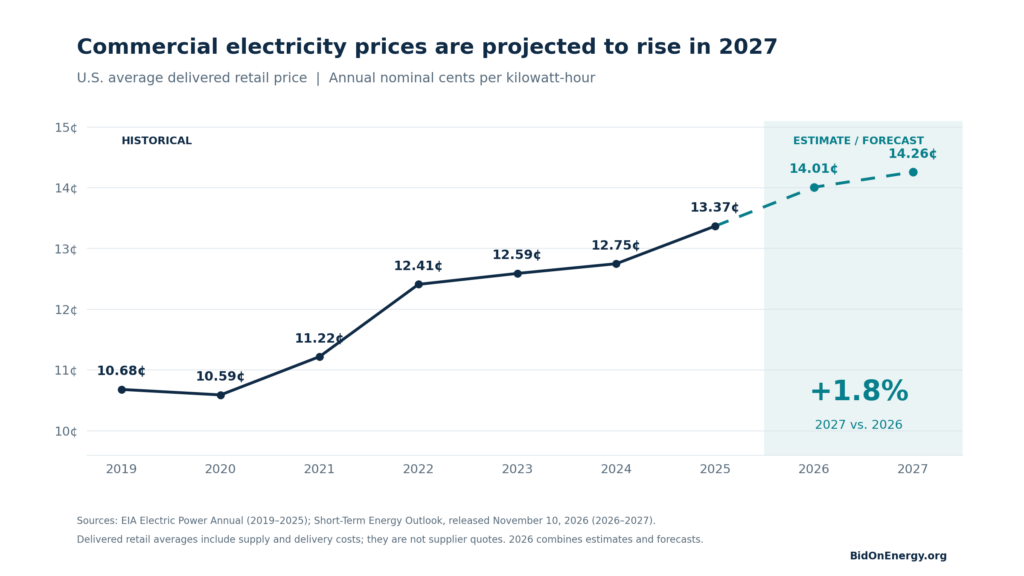
The projected 2027 average is approximately 6.7% above 2025. A slower rate of increase therefore still leaves businesses planning around a higher price level. For budgeting perspective, a 0.25-cent increase applied to 1,000,000 kWh equals $2,500 annually, holding consumption constant. This calculation illustrates the national benchmark’s change; it does not predict the increase for a particular property.
What the national number actually measures
EIA’s retail averages divide electricity revenue by electricity sales. They include generation, transmission, distribution, taxes, and fees. They are delivered electricity averages, rather than individual utility tariffs or supply-only contract offers.
A business should therefore avoid comparing a supplier’s 10-cent supply offer directly with the 14.26-cent national figure. First identify the charges included in each price. Then compare equivalent supply costs and separately budget the charges that remain outside the agreement.
Forecasts also change. Weather, fuel supply, demand, infrastructure schedules, and market rules can shift before or during 2027. Use this outlook to understand the direction of the market and the risks to discuss with suppliers, while using account-specific quotations to make a purchasing decision.
Regional electricity costs will vary substantially
EIA projects 2027 commercial retail averages ranging from 9.44¢/kWh in the West South Central division to 23.69¢/kWh in New England. The Pacific division is projected at 22.11 cents, the Middle Atlantic at 19.20 cents, and the East North Central division at 14.36 cents.
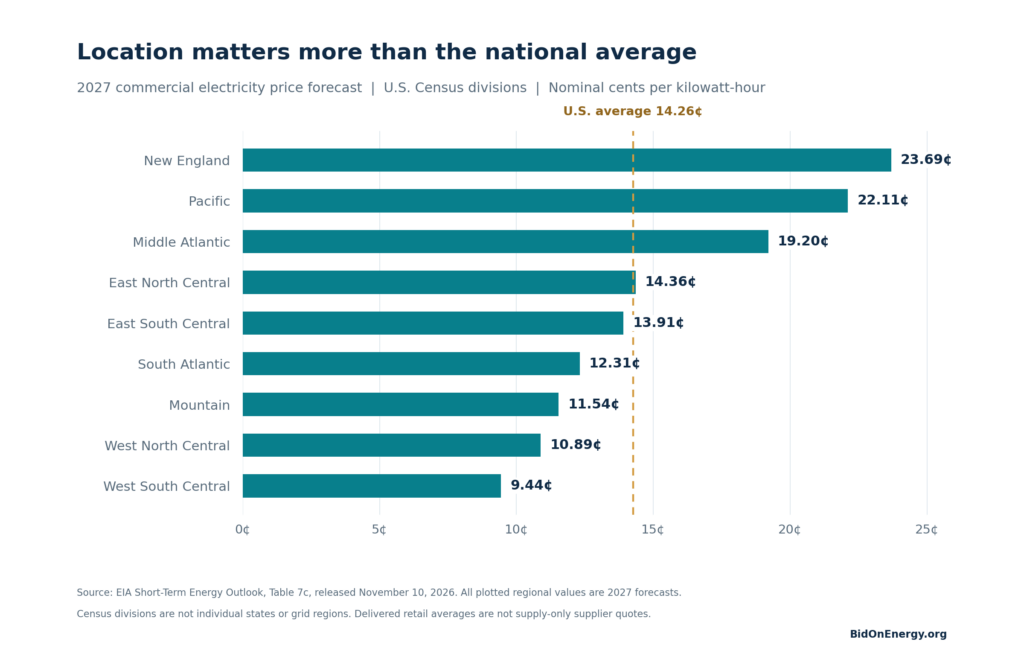
These geographic groupings require care. New England includes Connecticut, Maine, Massachusetts, New Hampshire, Rhode Island, and Vermont. The Middle Atlantic includes New York, New Jersey, and Pennsylvania. West South Central includes Arkansas, Louisiana, Oklahoma, and Texas. Its average cannot be treated as a Texas supplier rate. Census divisions also differ from the territories operated by regional electricity grid organizations.
Our buying recommendation: make the utility and account class the starting point for every comparison. A ZIP code helps locate the service area, but the bill identifies the tariff, customer classification, and meter details suppliers need to evaluate the account. For businesses with several locations, price each meter on its own facts before deciding whether a combined procurement produces a better result.
Regional averages are useful for broad budgeting and portfolio context. They do not establish what a restaurant, warehouse, medical office, hotel, or manufacturer should pay. Two nearby businesses can have different operating schedules, peak demand, and service requirements, which must be reflected in the proposals they compare.
Why electricity costs can rise while natural gas prices fall
Fuel prices offer some relief
EIA forecasts the Henry Hub natural gas benchmark to fall from $3.37 per million British thermal units in 2026 to $2.88 in 2027, a decline of about 14.5%. It expects domestic production growth to exceed growth in combined domestic demand and exports. The same outlook still projects LNG exports increasing to approximately 19 billion cubic feet per day in 2027
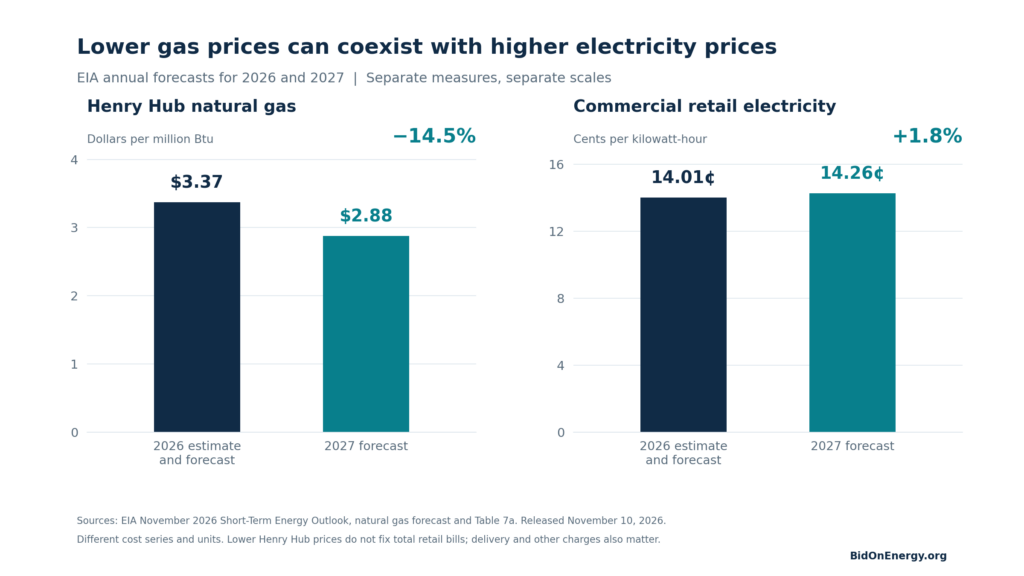
The purchasing implication is balanced: lower fuel costs may create opportunities, but they do not establish the price of a business’s next electricity contract. A national annual gas forecast also cannot identify the lowest day to sign a regional power agreement. Ask suppliers to explain the complete offer and the costs that remain adjustable.
Commercial electricity demand continues growing
EIA projects commercial electricity sales of 1,557.0 billion kWh in 2026 and 1,600.2 billion kWh in 2027, an increase of approximately 2.8%. That would put 2027 sales about 6.4% above 2025. EIA attributes broader generation growth to commercial demand and weather, while expecting residential demand to ease under its 2027 weather assumptions.
Demand growth does not affect every location equally. For procurement, the relevant issue is whether the utility territory and delivery period in your quote face particular constraints. Ask how your supplier has priced those exposures instead of assuming a national demand increase creates the same premium everywhere.
New generation and storage can moderate pressure
EIA expects utility-scale solar to supply nearly 10% of U.S. electricity generation in 2027, compared with 7% in 2025, while wind rises from 11% to 12%. Its capacity table projects electric power sector solar photovoltaic capacity reaching 221.9 GW and battery storage reaching 91.7 GW at the end of 2027.
These additions provide a reason to consider scenarios with easing wholesale costs. Their location, completion dates, and availability during periods of high demand still matter. Battery capacity in gigawatts measures power, rather than the duration of stored energy; it should not be interpreted as a separate source of fuel.
Grid and delivery costs remain part of the bill
Electricity prices also reflect the cost of building, financing, operating, and maintaining generation and transmission and distribution infrastructure. EIA identifies fuel, power plant costs, the grid, weather, and regulation as important pricing factors.
Consequently, fuel relief and higher delivered electricity prices can coexist. A procurement plan should examine supplier-controlled charges and utility-controlled charges separately so that a change in one is not mistaken for a change in the entire bill.
Capacity costs deserve close attention in 2027 contracts
Capacity markets pay for resources to be available when needed. Businesses should ask whether these costs are included in the quoted rate, billed separately, or subject to an adjustment. The answer is especially relevant to agreements that extend across multiple capacity delivery years.
PJM prices remain elevated after the earlier reset
UCAP means unforced capacity, which adjusts a resource’s capacity for its expected reliable availability.
The benchmark rose sharply between 2024/25 and 2025/26. The published 2027/28 result of $333.44 per UCAP MW-day is only about 1.3% above 2026/27. The already completed 2028/29 auction cleared at $325.00, approximately 2.5% lower, under the applicable price collar. These results support planning for elevated capacity costs, while avoiding an assumption that the earlier surge repeats annually.
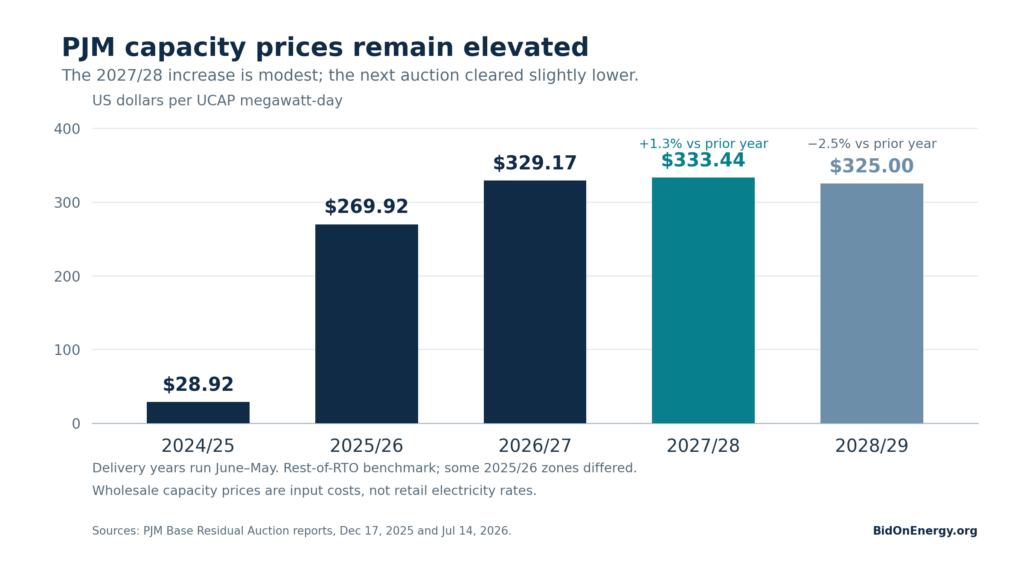
Calendar 2027 spans two PJM delivery years: January through May falls in 2026/27; June through December falls in 2027/28. The customer’s actual exposure depends on its assigned capacity obligation and the supplier contract. An auction percentage change therefore should not be applied directly to the whole electric bill.
Other regions require their own analysis
New England: ISO New England reports a forward capacity auction price of $3.580 per kW-month for 2027/28, compared with $2.590 for 2026/27, an increase of approximately 38.2%. This applies to that capacity price component, not the customer’s total bill. The units and market structure differ from PJM’s.
Illinois: ComEd participates in PJM, while Ameren Illinois is in MISO. MISO’s annual planning resource auction has a separate cycle and rules. A PJM capacity figure should not be inserted into an Ameren Illinois comparison
Texas: evaluate the actual retail offer, delivery territory, and exposure to market pricing. ERCOT cautions that its preliminary long-term load forecast incorporates proposed large loads and is not a prediction of everything that will be built. Proposed data centers should not automatically be counted as certain 2027 consumption.
For an agreement extending beyond 2027, ask the supplier to identify which years have known capacity inputs, which use assumptions, and which costs can be reset. Require the adjustment mechanism in writing before comparing an adjustable offer with a more fully fixed product. Published auction outcomes may already be included in current quotations; do not add them again to a price that covers capacity.
How to compare commercial electricity suppliers correctly
Supplier choice can change the electricity supply arrangement while the local utility continues delivering electricity and maintaining the wires in applicable competitive markets. Delivery charges remain part of the budget. Eligibility and available products depend on the jurisdiction, utility, supplier, and customer class.
We recommend a comparison process that starts with the account, standardizes the bidding request, and evaluates the final contract alongside the headline rate.
Prepare a complete account profile
Gather a recent electricity bill, the correct utility rate schedule, and the current agreement. Record the service address, meter or account identifiers, contract end date, and renewal notice deadline. The Pennsylvania PUC’s business shopping guidance similarly starts with the bill, distributor, and rate schedule, and notes that supplier eligibility standards vary.
For a meaningful business comparison, also prepare 12 months of kWh usage, peak kW where available, and interval data for a more detailed review. Identify any planned changes in hours, equipment, occupancy, electric vehicle charging, solar generation, or number of locations. A quotation should reflect the business you expect to operate during the agreement.
Give suppliers the same bidding instructions
Request offers for the same start month, account list, consumption forecast, and contract duration. Ask for 12-, 24-, and 36-month options where available, with longer terms considered only when they fit the business’s operating horizon. Set the same renewable energy requirements and specify the cost components that must be included.
Use quotations prepared close together in time and confirm their validity deadlines. Record the supplier, product name, rate, term, and assumptions in one comparison. A proposal that has expired should be refreshed before it is treated as an available alternative.
Read the cost and risk allocation
Check these items in each agreement
- Included charges: energy, capacity, transmission where applicable, ancillary services, losses, and renewable compliance.
- Adjustments: pass-through costs, capacity resets, change-in-law provisions, and how each amount is calculated.
- Usage obligations: minimums, maximums, volume tolerances, and charges if actual usage falls outside an agreed range.
- Timing and exit terms: service start and end, renewal treatment, notice deadlines, and early termination calculations.
- Billing and credit: deposits, payment terms, recurring fees, and responsibility for separate utility charges.
The word “fixed” requires context. The contract must identify what is fixed and what can change. Transmission can appear within supply or delivery depending on the market, so use the actual agreement and utility bill to avoid omissions or double counting.
Choose the product that matches the budget
| Product approach | Potential benefit | Question to resolve |
|---|---|---|
| Fixed supply with defined inclusions | More predictable covered price per kWh | Which charges and usage conditions remain outside the fixed price? |
| Fixed energy with capacity or other adjustments | Separates energy pricing from specified market costs | How are adjustments calculated, and what is the potential budget exposure? |
| Indexed or variable supply | Retains exposure to falling market prices | Can the business absorb higher prices during adverse periods? |
Product categories are general. Supplier availability and actual contract language govern the offer. Fixed supply does not fix monthly consumption or every charge on the bill.
Our recommendation is to decide first how much uncertainty the business can tolerate. Then compare the cost of products that meet that requirement. A business with tight cash-flow limits may value predictable covered costs differently from an operator able to manage market exposure actively.
For larger or more complex accounts, ask whether custom bidding can improve the fit compared with standard matrix pricing. Bid On Energy describes custom procurement using actual usage, peak demand, seasonality, tariff, and interval information where available. Custom pricing can use fixed, indexed, or blended structures; it does not itself determine price risk. Qualification and results depend on the account and suppliers.
Understand load factor and the peaks that affect your price
Load factor measures average load relative to peak load over the same period. The equivalent energy-based calculation is:
Load factor (%) = kWh ÷ (measured peak kW × hours in the period) × 100
For example, 36,000 kWh and a 100 kW peak over a 30-day period produce a 50% load factor. Use the same period for every input. This describes the load pattern; increasing unnecessary consumption to raise the ratio would not be an efficiency improvement.
Supplier qualification can use a different measure based on annual consumption and an assigned system-peak capacity tag. That tag is not necessarily the highest demand shown on a monthly bill. PJM distinguishes a customer’s own maximum demand from its contribution to a system peak; Connecticut’s official supplier guidance also explains capacity-tag-based load-factor qualifications
Ask which definition applies to your offer, whether a minimum load factor is required, and what happens if the account falls below it. Reducing a monthly peak does not automatically reduce every capacity-related charge. Evaluate the actual tariff and agreement.
What a lower commercial electricity rate can mean in dollars
The financial value of a rate difference becomes clear when it is multiplied by actual usage:
Annual supply cost difference = annual kWh × difference in comparable rates in dollars per kWh
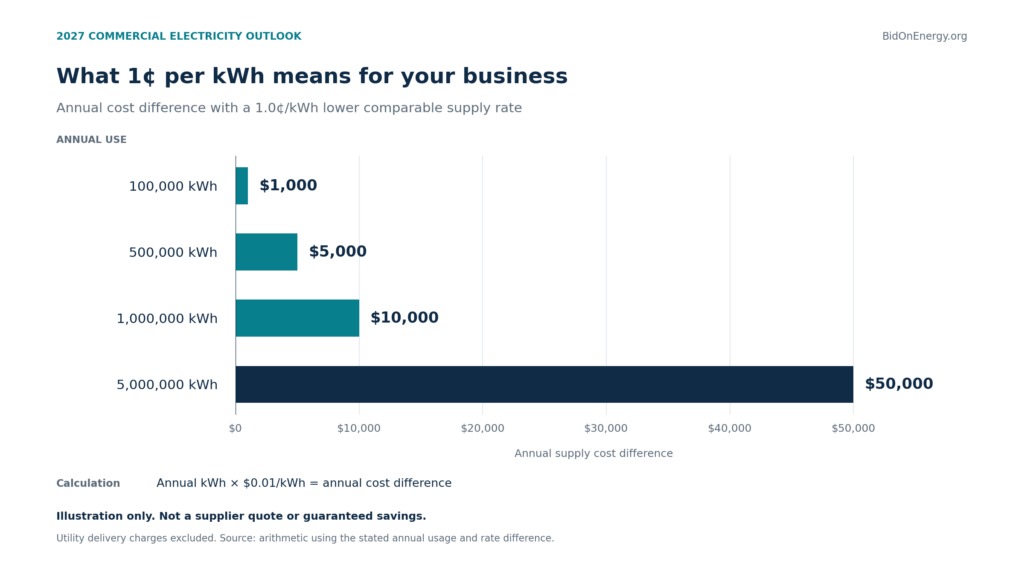
For example, a business using 1,000,000 kWh annually would spend $10,000 less on the covered supply component if it obtained an equivalent rate 1 cent per kWh lower. The result assumes identical usage, dates, included charges, and fees.
Consider this separate hypothetical comparison:
| Illustrative offer | Quoted headline rate | Additional supply components | Comparable supply cost |
|---|---|---|---|
| Offer A | 8.0¢/kWh | 3.0¢/kWh assumed | 11.0¢/kWh |
| Offer B | 10.0¢/kWh | Included in this example | 10.0¢/kWh |
Offer B would be cheaper under these assumptions, even though Offer A advertises a lower energy rate. Both examples exclude utility delivery charges. If Offer A’s additional components vary, its actual cost would also vary. This is why the comparison must include every relevant component.
Use the correct benchmark when describing savings: a comparable supplier renewal, an alternative supplier offer, or applicable utility default service for the same account. A current utility default rate may not stay unchanged for the full proposed contract. If a multiyear calculation assumes future default prices, show those assumptions rather than presenting the result as guaranteed savings.
A practical electricity purchasing plan for 2027
Start before the renewal deadline
For agreements renewing in early 2027, begin the account review now. For later expirations a useful planning window is approximately 90–180 days before renewal, with more lead time for complex portfolios. This is a procurement recommendation, not a regulatory deadline or a requirement to sign immediately.
Start by documenting the current contract and the business’s budget target. Decide who can approve a purchase, what information that person needs, and what level of price or contractual risk is acceptable. This makes it easier to act on a suitable offer while it remains valid.
Compare term choices without assuming longer is cheaper
A longer agreement extends the period of covered price certainty, but it can also extend commitments that become inconvenient if the business moves, closes, installs solar, or changes its load. A shorter agreement brings the next renewal forward. Compare actual prices and contractual flexibility across terms; duration alone does not establish value.
Avoid relying on a calendar rule such as “spring is always cheapest.” Use market developments to refresh competing offers and evaluate them against the budget. With fuel prices forecast to ease but other costs still important, the current evidence supports a measured comparison rather than a universal instruction to lock every account for the longest available term.
Test the budget against changes in both price and usage
Build a base case using expected monthly consumption and the proposed contract. Then test plausible business changes, such as longer operating hours or a new production line. For an adjustable product, also test higher values for the components that remain exposed.
As an illustration, 1,000,000 kWh at a 10-cent supply rate costs $100,000. A 10% usage increase alone raises that amount to $110,000. If both usage and the effective supply rate rise 10%, the amount becomes $121,000, a 21% increase. These are arithmetic scenarios, not EIA forecasts or probability estimates.
A budget should identify the covered supply cost, adjustable supply items, utility delivery and demand charges, taxes, and recurring fees separately. Assign an owner to verify the first bills after a switch against the agreement and expected start date.
Reduce avoidable consumption alongside supplier shopping
Review HVAC and lighting schedules, maintain controls and equipment, and check for unnecessary after-hours operation. ENERGY STAR recommends periodic operational reviews and after-hours walkthroughs to identify waste.
For demand-billed accounts, ask which peaks actually determine the charges before changing equipment schedules. Review solar, storage, and demand-response proposals against the tariff and operating needs. Projects should earn their place through account-specific economics and feasibility.
Track usage and cost after each change. Separate the effect of a lower rate from changes in weather, occupancy, or production. This gives management a clearer view of what the procurement and operational work actually accomplished.
Compare 2027 electricity offers with Bid On Energy
Bid On Energy helps eligible businesses review their electricity requirements and compare offers from several competing energy suppliers. Its process includes reviewing usage, load profile, and contract information, requesting bids, and presenting offers side by side. The company advertises rate comparisons with no cost and no obligation.
Businesses in competitive markets can ask for a review of available supply rates, contract terms, and custom pricing eligibility. Availability depends on the state, utility territory, account class, and participating suppliers. The objective is to find the lowest suitable available rate among comparable offers for the business’s needs.
Prepare your 2027 electricity budget with a current supplier comparison. Send a recent utility bill and your existing contract’s expiration date. Include expected changes in consumption or operations so that the comparison reflects the year ahead.
Compare Commercial Electricity Suppliers with Bid On Energy
Call (302) 360-8110 or email Support@BidOnEnergy.org.
Frequently asked questions about the 2027 outlook
Will every business pay more for electricity in 2027
No. A rising national average does not determine an individual account’s renewal price. The expiring agreement, local market, usage profile, and new contract can produce a different result. Compare current offers for the actual service period.
Does a fixed supply rate fix the entire electricity bill
No. Consumption, utility charges, and any contractually adjustable components can change. The agreement should state which costs are fixed and identify exclusions.
Should a business wait because natural gas is forecast to fall
That forecast is one input to consider. It does not establish when supplier electricity offers will reach their lowest level. Compare current terms, the cost of waiting, your renewal deadline, and the business’s capacity to handle uncertainty.
Can comparing suppliers guarantee savings
No savings figure can be established before comparable offers and the relevant baseline are reviewed. A comparison can reveal a lower rate, improved certainty, better flexibility, or that an existing option remains competitive.
What information should a business send first
Start with a recent electricity bill and the current contract’s expiration date. Monthly usage history, peak demand, and planned operational changes help develop a more useful comparison. Larger or complex accounts should ask whether interval data and custom bids are appropriate.
Sources and methodology
This article uses information available on November 12, 2026. EIA projections are from the November 2026 Short-Term Energy Outlook, released November 10 with modeling completed November 5. The archived report preserves the forecast vintage; EIA’s current table URLs update with subsequent releases. Prices are nominal U.S. cents per kWh unless another unit is specified. Historical annual prices use EIA Electric Power Annual data. Regional forecasts are Census-division averages.
Percentage changes are calculated from the cited values and rounded. Capacity figures are published auction outcomes for specified delivery periods, rather than forecasts of total retail bills. The supplier comparison examples and budget scenarios are illustrative calculations. The featured image is an editorial illustration; the five charts are drawn from cited data or explicitly stated arithmetic.
Compare Commercial Electricity Suppliers with Bid On Energy
Call (302) 360-8110 or email Support@BidOnEnergy.org.